Code Collaborator system status reports can be found on the System Status page.
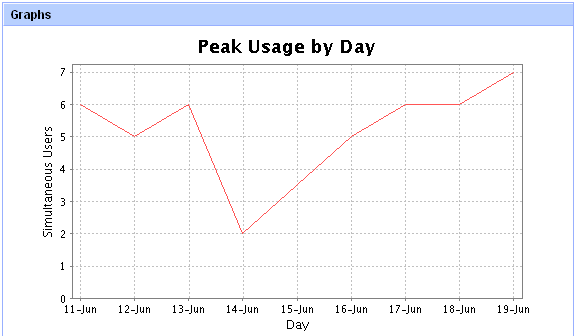
The "Peak Usage" chart plots the maximum number of simultaneous users, measured by day:

This is most useful when determining the number of floating seats necessary to handle your Code Collaborator traffic. In the example above, 7 floating seats would probably be sufficient.
Server Backup/Debugging Dump
You can also find the server backup form here.
Many server parameters are displayed. These are typically useful only when debugging problems.
System Information
Following the debugging forms, charts will display a long list of charts is a long list of system information. These charts will include:
| • | Debugging (Diagnostic Utility) |
| • | Client/Server Connection |
| • | Database Connection |
| • | Server Properties |
| • | VM Information |
These charts will be mainly used to gather system information for our Technical Support when trouble should arise.